Financial Vehicles
Understand every type of investment vehicle and when to use each one.
- What is a Vehicle?
- Vehicle Types — Mirror, Manual History, Manual History + Future, Target Date Fund, Synthetic Dividend, Fixed Rate Symbol, CASH, BOND
- Common Vehicle Fields
- Vehicle Performance View
- Mutual Fund Example
What is a Financial Vehicle?
A vehicle is any investment you hold: a stock, ETF, mutual fund, GIC, bond, or even a cash balance. Vehicles are the building blocks of your accounts and holdings.
Every vehicle has a symbol (a unique identifier), a type, and a price history — either pulled from market data or entered manually. The price history is what the projection engine uses to model future performance.
RetirePlan separates vehicles from holdings because the same investment (e.g., XDIV.TO) might appear in multiple accounts. You define it once as a vehicle; then add it as a holding in each account where you own it.

Vehicle Types
The vehicle type determines how the engine gets its price and return data.
Auto Mirror Vehicle
A mirror vehicle borrows its price history from another vehicle or market index. Use this when you have an investment that closely tracks a well-known benchmark but doesn't have its own downloadable history.
When to use:
- A Canadian ETF that tracks the S&P 500 (e.g., set mirror to
^GSPCorSPY) - A fund whose performance you believe matches a particular index
- Testing: "what if I replaced this fund with one that tracked the TSX?"
How to set up: Create or edit a vehicle, scroll to Close Mirror, click Browse to pick from existing vehicles/indexes, or type the symbol directly. The engine uses the mirrored vehicle's price series as if it were this vehicle's own.

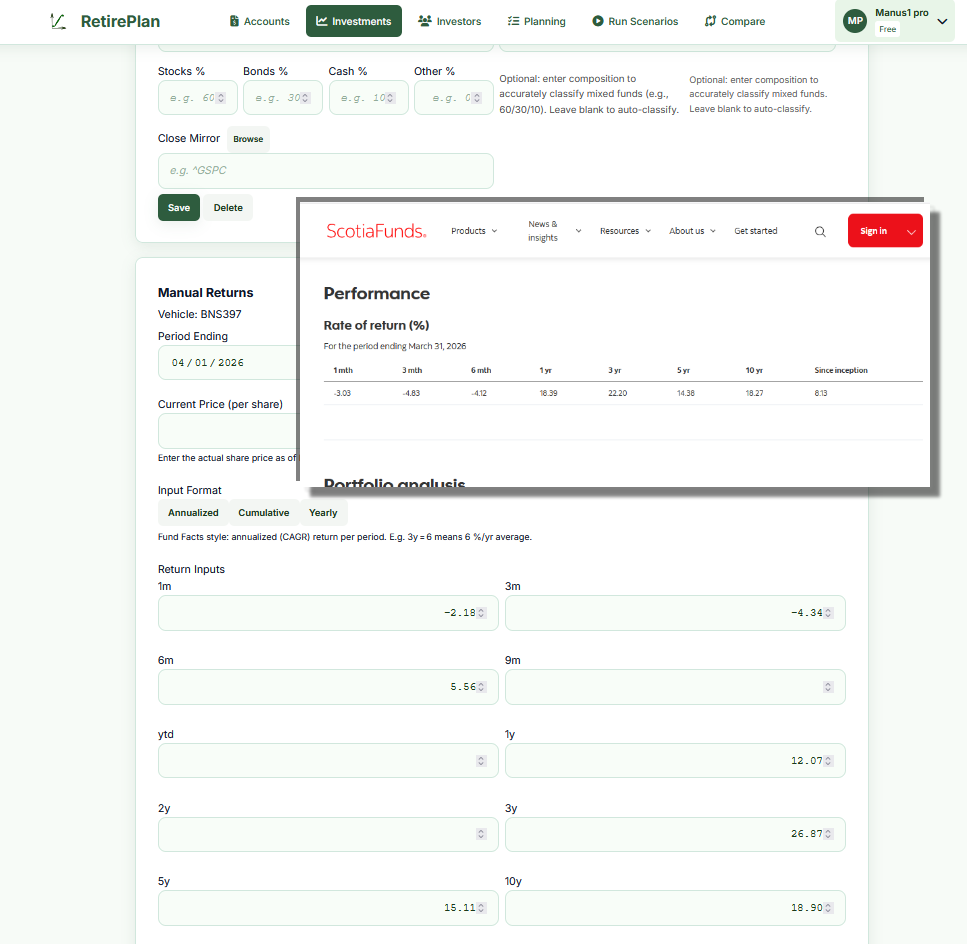
Manual Manual History
Enter annualized return percentages for specific past periods. The engine builds a synthetic price history from these numbers. No real market data is downloaded.
When to use:
- Mutual funds that publish 1y, 3y, 5y, 10y returns in their fund fact sheet (e.g., from your bank or investment firm)
- Investments without public ticker symbols
- GICs at a locked-in rate for a specific period
- Any investment where you want to model specific historical performance
Input formats:
- Annualized: Enter the compound annual growth rate (CAGR) for each period. A 5y annualized return of 8% means the fund grew at 8% per year on average over 5 years. This is what fund fact sheets typically report.
- Cumulative: Enter total percentage gain over the period (not annualized). If you know the fund returned 48% over 5 years total, enter 48 for 5y.
- Yearly: Enter each calendar year's return separately — useful if you have year-by-year data.
Period Ending: Set this to the date your data is "as of" — usually the most recent month-end.
Your bank's fact sheet shows: 1y +10.5%, 3y +25.8%, 5y +15.1%, 10y +18.7%
→ Create vehicle
BNS397, click Manual Returns, select Annualized format, enter those values, set Period Ending to today.

Fixed Fixed-Rate Symbol (SYMBOL-X.XX%)
A shorthand way to create a vehicle that earns a specific fixed annual return. The convention is to append -X.XX% to any symbol name. The engine reads the rate directly from the symbol name — no manual entry needed.
Examples:
BOND-4.00%— a bond paying exactly 4% per yearGIC-5.25%— a GIC at 5.25%SAVINGS-3.00%— a savings account paying 3%
Special CASH
The reserved symbol CASH represents liquid cash in an account. It has zero price appreciation and no dividends. Add CASH holdings to any account where you hold a cash balance.
The engine treats CASH as a liquidity reserve — it can be drawn down before other holdings need to be sold, reducing unnecessary selling of investments. CASH is classified as 100% cash in portfolio risk calculations.
Special BOND / Fixed Income
Bonds can be modeled in two ways:
- Fixed-rate bond: Use the
BOND-X.XX%symbol convention (e.g.,BOND-4.00%) for a simple fixed-return bond - Mutual fund / ETF that holds bonds: Search for its ticker (e.g.,
XBB.TOfor the iShares Core Canadian Universe Bond Index ETF) — it will pull real market data and price history
For a manual vehicle representing a bond fund with no ticker: create a vehicle with type Bond, enter manual returns from the fund's fact sheet, and optionally add a synthetic dividend for the coupon yield.
Step-by-Step: Adding a Mutual Fund
Mutual funds typically don't have freely downloadable price data. Here's how to model one using the returns from a fund fact sheet.
- Go to Investments → Vehicles
- In the Symbol field, enter a code for the fund (e.g.,
RRSP-FUND1). It doesn't have to match any real ticker. - Set Type to Mutual Fund, select your exchange and currency
- Enter Composition if the fund is balanced fund (e.g., 60% stocks, 35% bonds, 5% cash)
- Enter Composition if the fund is money-market fund (e.g., 0% stocks, 0% bonds, 100% cash)
- Enter Composition if the fund is bond fund (e.g., 0% stocks, 100% bonds, 0% cash)
- Click Save
- Click Manual Returns
- Set Period Ending to the date on your fund fact sheet
- Select format Annualized
- Enter the returns from the fact sheet: 1y, 3y, 5y, 10y (leave any periods blank that aren't available)
- If the fund pays distributions, enter an Annual Yield % and select a frequency
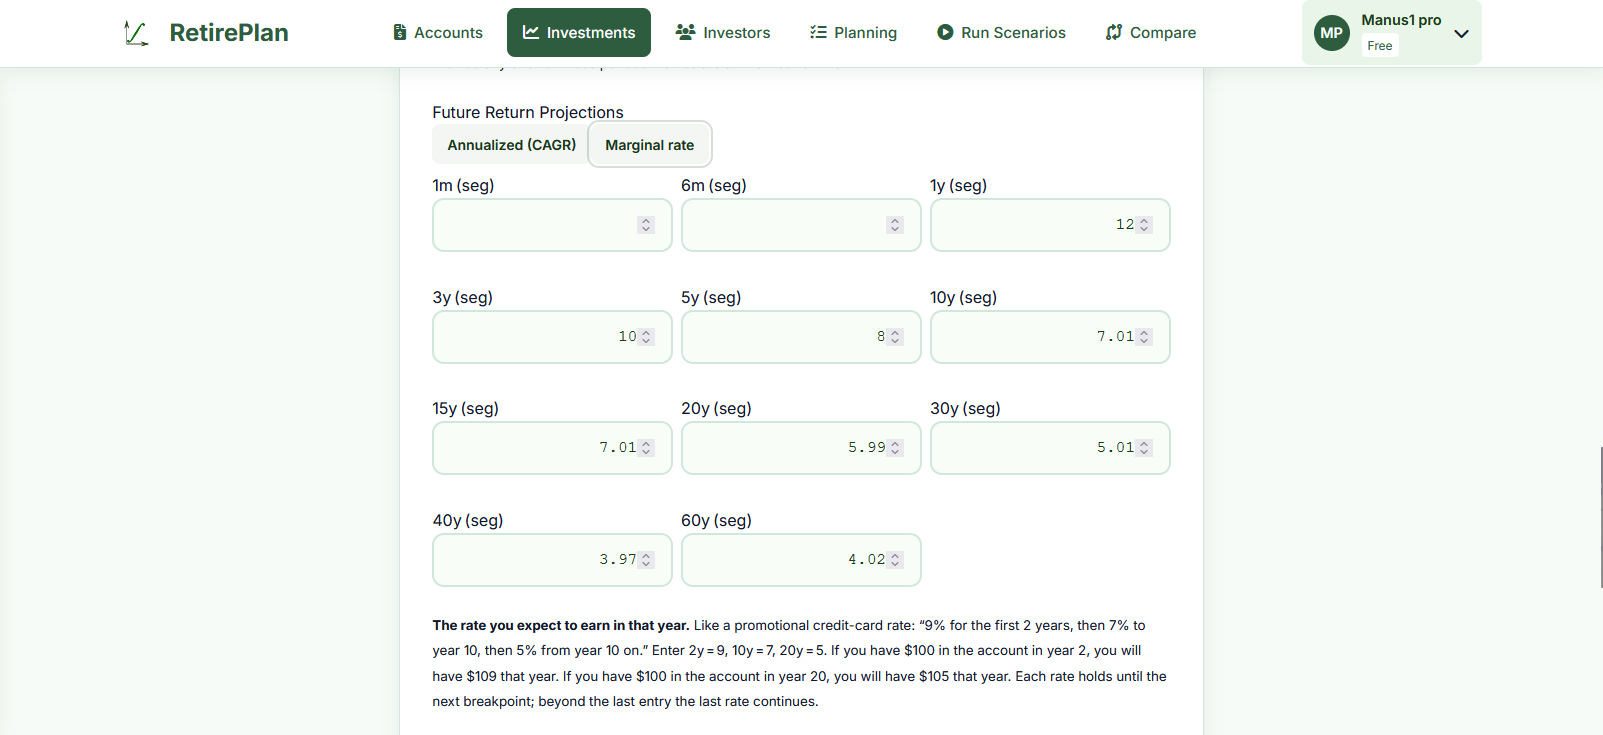
- If you have a view on future returns, enter those in the Future Return Projections section
- Click Save on the manual returns panel
Enter: 1y=10.5, 3y=8.2, 5y=7.1, 10y=6.8. Synthetic Dividend: Annual Yield=3.5%, Frequency=Quarterly.
Manual Manual History + Future Projections
Extends Manual History by also specifying future return assumptions. When you enter future return periods, the engine uses those instead of its machine-learning projection for this vehicle. This is powerful for modeling known or expected rates.
When to use:
- GIC or guaranteed investment maturing in steps: you know it returns 5% for 2 years, then the lock-in ends
- A fund whose manager has communicated target returns
- Conservative planning: you want to cap projected growth at a specific rate
Input modes for future returns:
- Annualized (CAGR): Enter the average annual return expected from today to each horizon. If you enter 7% for 10y, the engine assumes 7% per year compounded to the 10-year mark.
- Marginal rate: Enter rates for each segment directly. "9% for years 1–3, then 7% for years 3–10." More precise control over how returns step down over time.
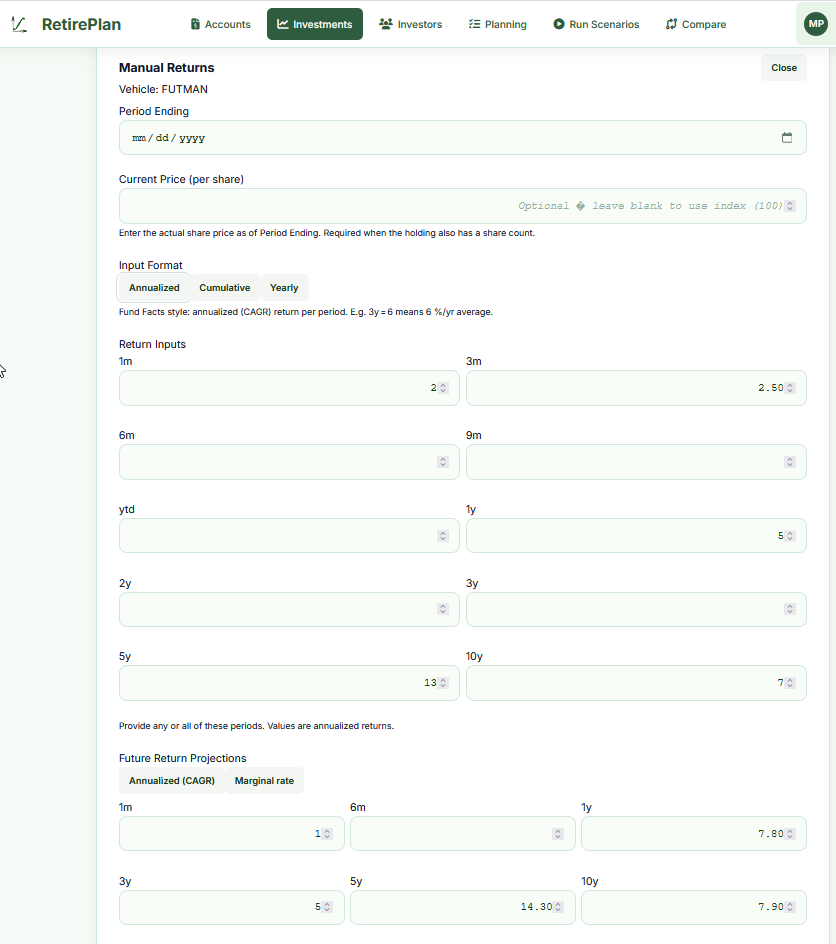
You have a 5-year GIC paying 5.2%. Enter: 1y=5.2, 3y=5.2, 5y=5.2, then 7y=4.0, 10y=4.0 (your best guess for reinvestment rate after the GIC matures).
Manual Target Date Fund
A target date fund (like Vanguard LifeStrategy or a balanced fund series) automatically shifts from aggressive to conservative as you approach a target retirement year. The fund's expected return steps down over time.
How to model it: Use the Future Return Projections with Annualized (CAGR) mode. Enter higher near-term returns reflecting the current equity-heavy allocation, and lower long-term returns reflecting the eventual bond-heavy allocation.
Currently 80% stocks / 20% bonds, shifting to 40/60 by 2035.
Enter: 1y=9, 3y=8, 5y=7.5, 10y=6, 15y=5.5, 20y=5, 30y=4.5
The engine uses each segment's implied rate, creating a natural deceleration.

Manual Synthetic Dividend
A synthetic dividend adds a regular cash income payment to a vehicle that wouldn't otherwise generate dividends — such as a manually defined vehicle or a bond. The payment is modeled forward from today; it does not backfill historical data.
When to use:
- A bond fund that pays a regular coupon (e.g., you expect 4% annual income from a bond ladder)
- A rental property or income trust modeled as a vehicle
- Any investment where you want to separately model a yield component vs. price appreciation
Fields:
- Annual Yield %: The expected annual income as a percentage of the current holding value. E.g., 4.33% on a $100,000 holding = $4,330/year income.
- Frequency: How often payments are made — Monthly (M), Quarterly (Q), or Yearly (Y).

Common Vehicle Fields
| Field | Notes |
|---|---|
| Symbol | Unique identifier. For publicly traded securities, use the market ticker (e.g., XDIV.TO). For manual vehicles, create any unique code (e.g., MYFUND, BOND-4.00%). |
| Type | Stock, ETF, Mutual Fund, Bond, Cash, Other. Affects how the asset is classified in portfolio composition and risk calculations. |
| Exchange / Currency | Exchange (TSX, NYSE, etc.) is informational. Currency affects how the vehicle's value is converted to CAD in projection totals. |
| Composition (Stocks / Bonds / Cash / Other %) | Optional. For mixed or balanced funds, enter the approximate percentage in each asset class. This is used for accurate risk calculation and asset allocation reporting. If left blank, the engine classifies based on vehicle type. Must sum to ~100%. |
| Close Mirror | If set, this vehicle's price history is taken from the mirrored vehicle instead of being downloaded or entered manually. See Mirror Vehicle above. |
| Industry / Sector | Optional labels for reference. Used in the Performance view for sorting and grouping. |
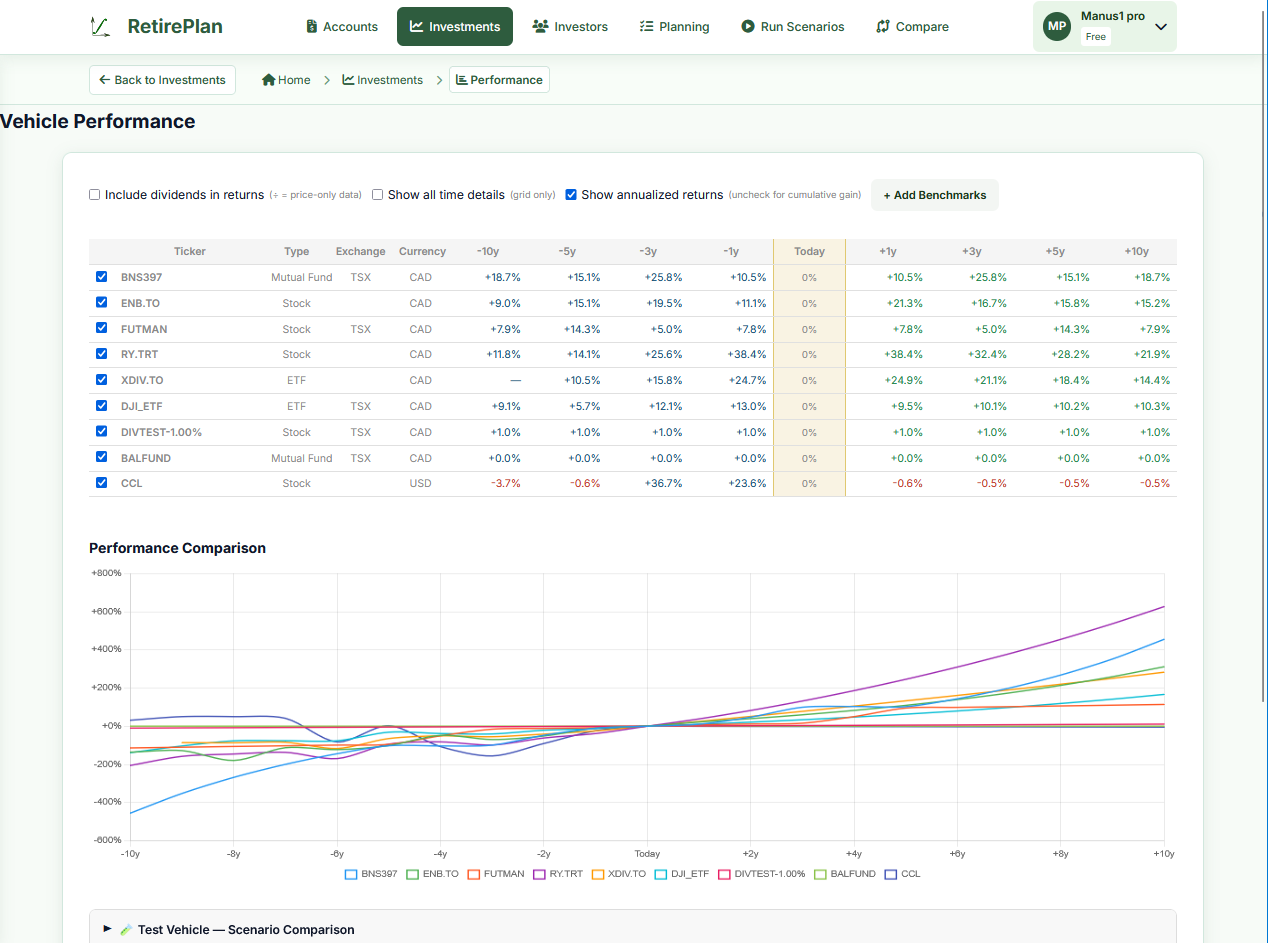
Vehicle Performance View
Path: Investments → Vehicle Performance
The Performance view shows all your vehicles in a grid with historical and projected returns, plus a chart for visual comparison. Use it to:
- See at a glance which vehicles have outperformed over 1y, 3y, 5y, 10y
- Compare your real holdings against a benchmark (click + Add Benchmarks)
- Use the Test Vehicle at the bottom to model a hypothetical vehicle by entering return assumptions — this is session-only and is never saved, making it safe to experiment without creating permanent records
- Toggle between annualized and cumulative returns using the checkboxes at the top
- The "Today" column is always 0% — it's the baseline; past columns show history, future columns show projected returns